What is your business worth?
A free valuation range for GCC business owners, in about three minutes. No account.
- Based on three named public deal datasets
- Five valuation methods
- VESTUP LIMITED, Hong Kong
- 30-day refund
What buyers paid in 2025.
Annual profit multiples by category, from three published deal datasets. The typical range runs from the category average to the top-quartile average.
| Category | Typical range | Average | Top quartile | Cross-check |
|---|---|---|---|---|
| SaaS | 2.5–6.0× | 2.7× | 5.8× | Acquire.com confirmed-sale median: 3.9× |
| Content sites | 2.5–5.5× | 2.6× | 5.5× | Newsletters: no separate public dataset; closest proxy |
| Marketplaces | 2.5–4.5× | 2.5× | 4.5× | — |
| Apps | 2.0–5.5× | 2.4× | 5.4× | — |
| E-commerce | 1.0–3.0× | 1.4× | 2.7× | Empire Flippers all-model average sale: about 2.0× |
| Agencies & services | 1.0–2.5× | 1.2× | 2.1× | — |
Sources:S1 FlippaS2 Acquire.comS3 Empire FlippersMethodology · Updated October 15, 2026
Circle = Flippa category average · Bar end = top-quartile average · Dashed = Empire Flippers all-model average
Sources:S1 FlippaS2 Acquire.comS3 Empire FlippersMethodology · Updated October 15, 2026
- Profit, not revenue. These are multiples of seller discretionary earnings or EBITDA over the last twelve months.
- Top quartile is earned. Buyers pay it for steady growth, low churn and clean books. The report shows which of these apply to you.
- Small deals sell lower. On Flippa, sales under $100K averaged 1.8× in 2025. Sales above $1M averaged 2.9×.
- Ranges, not promises. Your number depends on your business. Use the free valuation to see where you sit.
How it works.
Four steps. You see your range before you are asked for anything.
Pick your model
SaaS, e-commerce, content, newsletter or agency.
Enter your numbers
Revenue, profit, growth and churn for the last twelve months.
Answer five questions
Owner dependence, concentration, records. Each one moves the multiple.
See your range
Low, mid and high on screen. The PDF report is optional.
Built for selling, not raising.
Startup valuation tools price a company for its next round. Brokers price it to list. VestUp prices it the way a buyer of a small digital business will.
| Item | VestUp | Startup valuation tools | Brokers and marketplaces |
|---|---|---|---|
| Built for | Founders preparing to sell | Founders raising capital | Listing and closing a sale |
| Basis | Published sale multiples | VC-stage methods | Broker opinion and listings |
| Cost | Free range, $39 report | Varies by plan | Success fee on sale |
| Time to a number | About 3 minutes | Varies | Days to weeks |
Note:Startup valuation tools: for example Equidam and Carta. Brokers and marketplaces: for example Flippa and Empire Flippers. Check each provider for current terms.
The $39 report, page by page.
A PDF you can send to a buyer, an adviser or your co-founder.
- Weighted valuation Five methods combined into one low, mid and high range.
- Adjustment waterfall How eight quality factors move your multiple, up or down.
- Sensitivity table Your value across growth and margin scenarios.
- Category benchmarks Published multiples for your category, with sources.
- Drivers and risks What lifts your value and what holds it back.
- 90-day plan The specific levers that raise your number, in order.
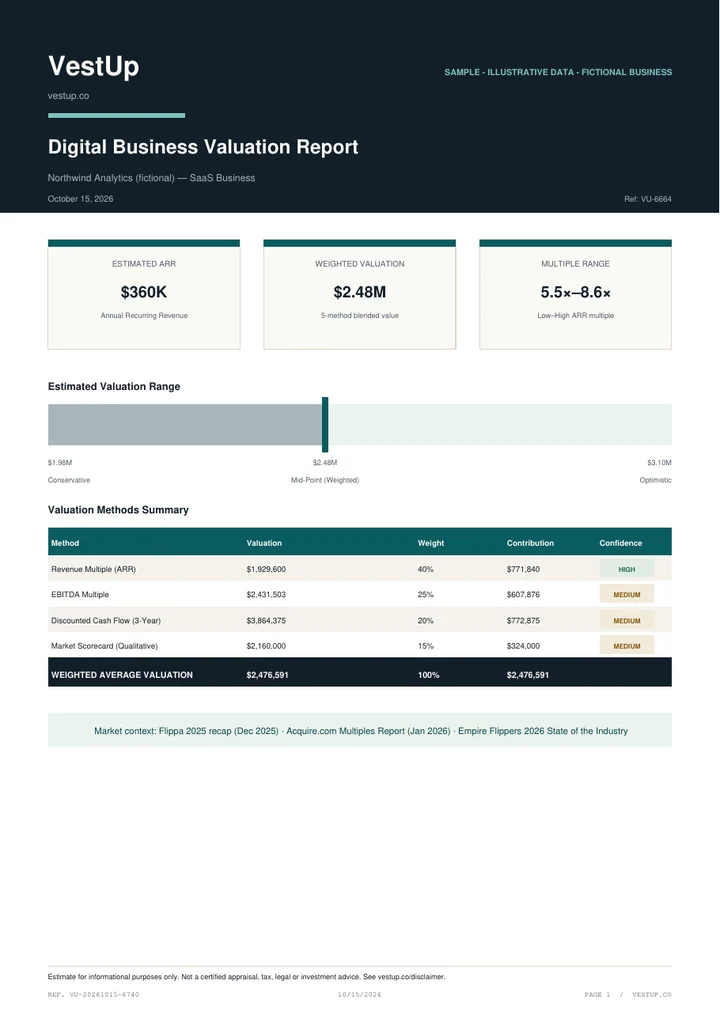
Sources:S1 FlippaS2 Acquire.comS3 Empire FlippersMethodology · Updated October 15, 2026
Common questions.
How do I value my online business without a broker?
What is a typical SaaS multiple right now?
Should I use VestUp or a startup valuation tool?
How accurate is the range?
Do you cover Saudi Arabia, the UAE and the wider GCC?
What if the report is not useful?
Is my data safe?
Know your number.
A free range in about three minutes. Pay only if you want the full report.